OpenAltimery and GEE Use Examples
Contents
OpenAltimery and GEE Use Examples
For the functions shown in the Google Earth Engine tutorial.
from utils.oa import dataCollector
If needed, uncomment below to authenticate Earth Engine.
# ee.Authenticate()
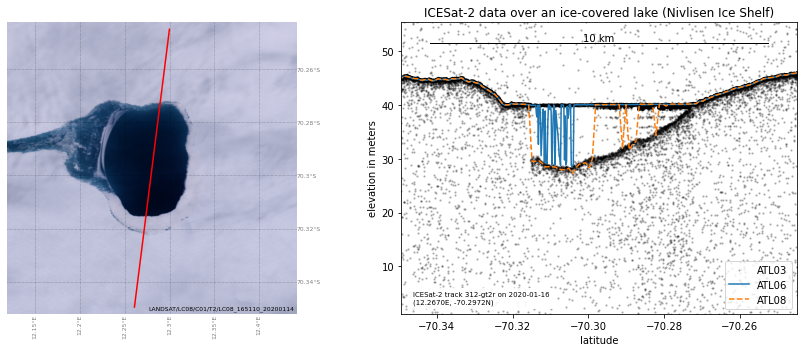
Example data from tutorial: melt lake on Nivlisen Ice Shelf
Input data
url = 'http://openaltimetry.org/data/api/icesat2/atl03?date=2020-01-16&minx=12.107692195781404&miny=-70.34956862465471&maxx=12.426364789894341&maxy=-70.2449105354736&trackId=312&beamName=gt3r&beamName=gt3l&beamName=gt2r&beamName=gt2l&beamName=gt1r&beamName=gt1l&outputFormat=json'
gtx = 'gt2r'

# initialize the dataCollector
myData = dataCollector(oaurl=url, beam=gtx)
Use geemap to find a satellite image
(Note: days_buffer=60 her because ICESat-2 passed over in the winter, when it’s completely dark in Antarctica…)
# myData.makeGEEmap()
Download and plot
Here we use crs='EPSG:3031' (WGS 84 / Antarctic Polar Stereographic) because we know we’re in Antarctica. This would default to crs='EPSG:3857' (Web Mercator) if we don’t specify it.
scene_id='LANDSAT/LC08/C01/T2/LC08_165110_20200114'
fig = myData.plotDataAndMap(scene_id, crs='EPSG:3031', title='ICESat-2 data over an ice-covered lake (Nivlisen Ice Shelf)')
Data has not yet been requested from OpenAltimetry yet. Doing this now.
---> requesting ATL03 data... Done.
---> requesting ATL06 data... Done.
---> requesting ATL08 data... Done.
This file already exists, not downloading again: downloads/LANDSAT-LC08-C01-T2-LC08_165110_20200114-8bitRGB.tif
Saved plot to: plots/LANDSAT-LC08-C01-T2-LC08_165110_20200114-8bitRGB-plot.jpg
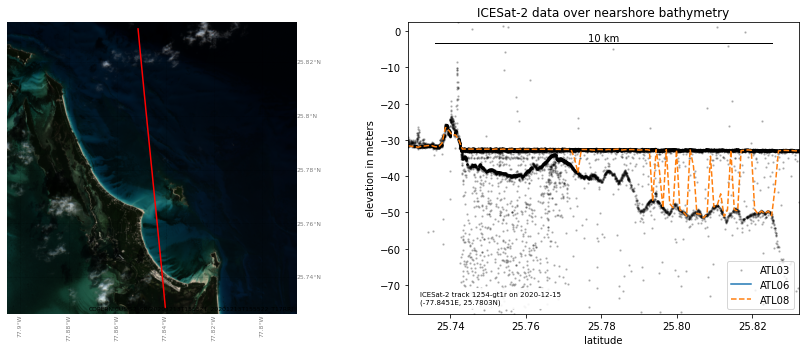
Nearshore Bathymetry
Input data
url = 'http://openaltimetry.org/data/api/icesat2/atl12?date=2020-12-15&minx=-77.858681&miny=25.728091&maxx=-77.831461&maxy=25.832559&trackId=1254&beamName=gt1r&beamName=gt1l&outputFormat=json'
gtx = 'gt1r'

# initialize the dataCollector
myData = dataCollector(oaurl=url, beam=gtx)
Use geemap to find a satellite image
# myData.makeGEEmap()
Download and plot
scene_id='COPERNICUS/S2_SR/20201213T155521_20201213T155522_T17RRJ'
fig = myData.plotDataAndMap(scene_id, title='ICESat-2 data over nearshore bathymetry')
Data has not yet been requested from OpenAltimetry yet. Doing this now.
---> requesting ATL03 data... Done.
---> requesting ATL06 data... Done.
---> requesting ATL08 data... Done.
Downloaded downloads/COPERNICUS-S2_SR-20201213T155521_20201213T155522_T17RRJ-8bitRGB.tif
Saved plot to: plots/COPERNICUS-S2_SR-20201213T155521_20201213T155522_T17RRJ-8bitRGB-plot.jpg
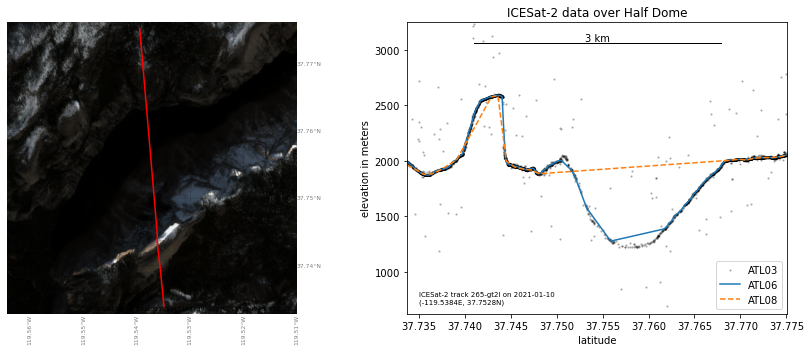
Half Dome
Input data
url = 'http://openaltimetry.org/data/api/icesat2/atl06?date=2021-01-10&minx=-119.587886&miny=37.730067&maxx=-119.488871&maxy=37.775582&trackId=265&beamName=gt3r&beamName=gt3l&beamName=gt2r&beamName=gt2l&beamName=gt1r&beamName=gt1l&outputFormat=json'
gtx = 'gt2l'

# initialize the dataCollector
myData = dataCollector(oaurl=url, beam=gtx)
Use geemap to find a satellite image
# myData.makeGEEmap()
Download and plot
scene_id='COPERNICUS/S2_SR/20210111T184739_20210111T184945_T10SGG'
fig = myData.plotDataAndMap(scene_id, title='ICESat-2 data over Half Dome')
Data has not yet been requested from OpenAltimetry yet. Doing this now.
---> requesting ATL03 data... Done.
---> requesting ATL06 data... Done.
---> requesting ATL08 data... Done.
Downloaded downloads/COPERNICUS-S2_SR-20210111T184739_20210111T184945_T10SGG-8bitRGB.tif
Saved plot to: plots/COPERNICUS-S2_SR-20210111T184739_20210111T184945_T10SGG-8bitRGB-plot.jpg
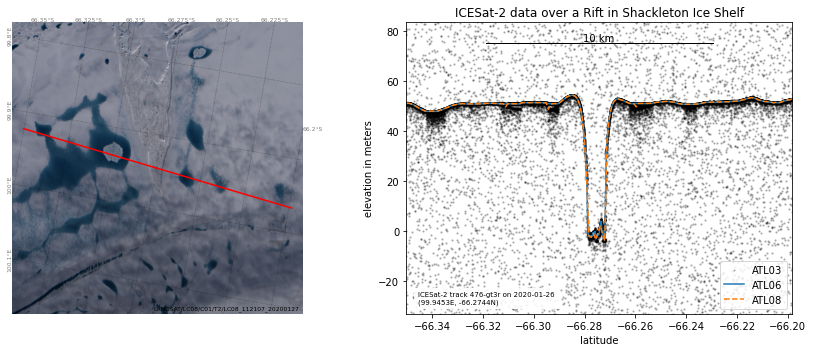
Ice Shelf Rift
Input data
url = 'http://openaltimetry.org/data/api/icesat2/atl06?date=2020-01-26&minx=99.85237589431291&miny=-66.35086607273658&maxx=100.0381369994367&maxy=-66.19796463586664&trackId=476&beamName=gt3r&beamName=gt3l&beamName=gt2r&beamName=gt2l&outputFormat=json'
gtx = 'gt3r'

# initialize the dataCollector
myData = dataCollector(oaurl=url, beam=gtx)
Use geemap to find a satellite image
# myData.makeGEEmap()
Download and plot
scene_id='LANDSAT/LC08/C01/T2/LC08_112107_20200127'
fig = myData.plotDataAndMap(scene_id, crs='EPSG:3031', title='ICESat-2 data over a Rift in Shackleton Ice Shelf')
Data has not yet been requested from OpenAltimetry yet. Doing this now.
---> requesting ATL03 data... Done.
---> requesting ATL06 data... Done.
---> requesting ATL08 data... Done.
Downloaded downloads/LANDSAT-LC08-C01-T2-LC08_112107_20200127-8bitRGB.tif
Saved plot to: plots/LANDSAT-LC08-C01-T2-LC08_112107_20200127-8bitRGB-plot.jpg
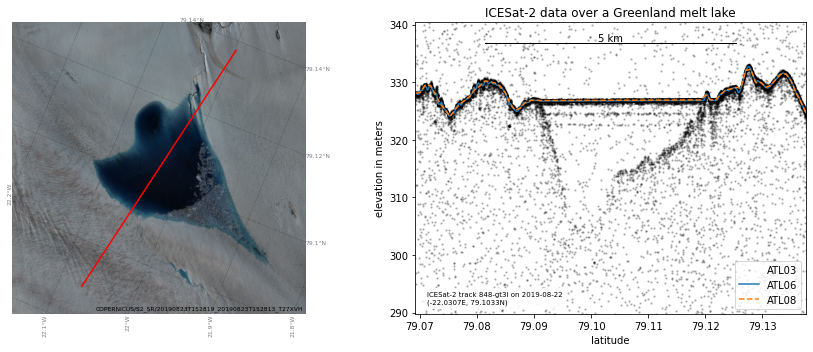
Melt Lake in Greenland
Let’s do this all at once
url = 'http://openaltimetry.org/data/api/icesat2/atl08?date=2019-08-22&minx=-22.184563606833546&miny=79.06859700015742&maxx=-21.876748966627616&maxy=79.1380278178076&trackId=848&beamName=gt3r&beamName=gt3l&beamName=gt2r&beamName=gt2l&outputFormat=json'
gtx = 'gt3l'
myData = dataCollector(oaurl=url, beam=gtx)
# myData.makeGEEmap()
scene_id='COPERNICUS/S2_SR/20190823T152819_20190823T152813_T27XVH'
fig = myData.plotDataAndMap(scene_id, crs='EPSG:3995', title='ICESat-2 data over a Greenland melt lake')
Data has not yet been requested from OpenAltimetry yet. Doing this now.
---> requesting ATL03 data... Done.
---> requesting ATL06 data... Done.
---> requesting ATL08 data... Done.
Downloaded downloads/COPERNICUS-S2_SR-20190823T152819_20190823T152813_T27XVH-8bitRGB.tif
Saved plot to: plots/COPERNICUS-S2_SR-20190823T152819_20190823T152813_T27XVH-8bitRGB-plot.jpg
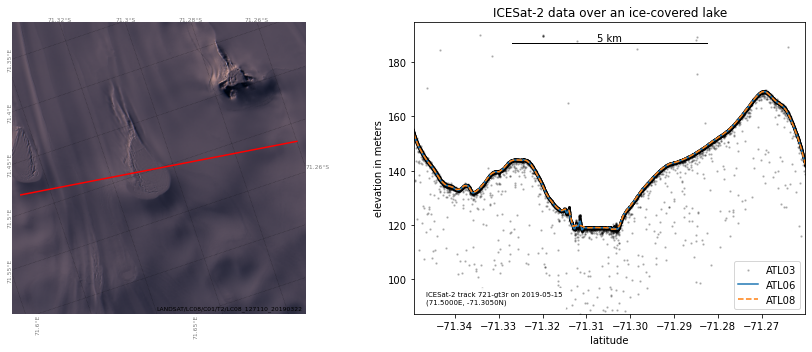
Ice-Covered Lake on Ice Shelf
(Note: we use days_buffer=60 her because ICESat-2 passed over in the winter, when it’s completely dark in Antarctica…)
url = 'http://openaltimetry.org/data/api/icesat2/atl06?date=2019-05-15&minx=71.42728712317059&miny=-71.35245299984994&maxx=71.58501878594811&maxy=-71.26628346466289&trackId=721&beamName=gt3r&beamName=gt3l&beamName=gt2r&beamName=gt2l&outputFormat=json'
track = 721
gtx = 'gt3r'
latlims = [-71.35, -71.26]
lonlims = [71.41, 71.59]
myData = dataCollector(date='2019-05-15', track=track, beam=gtx, latlims=latlims, lonlims=lonlims)
# myData.makeGEEmap()
scene_id='LANDSAT/LC08/C01/T2/LC08_127110_20190322'
fig = myData.plotDataAndMap(scene_id, crs='EPSG:3031', title='ICESat-2 data over an ice-covered lake')
Data has not yet been requested from OpenAltimetry yet. Doing this now.
---> requesting ATL03 data... Done.
---> requesting ATL06 data... Done.
---> requesting ATL08 data... Done.
Downloaded downloads/LANDSAT-LC08-C01-T2-LC08_127110_20190322-8bitRGB.tif
Saved plot to: plots/LANDSAT-LC08-C01-T2-LC08_127110_20190322-8bitRGB-plot.jpg
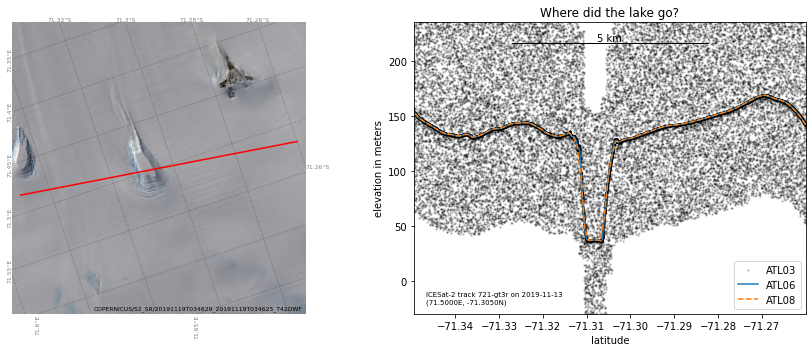
Change the date only
myData = dataCollector(date='2019-11-13', track=track, beam=gtx, latlims=latlims, lonlims=lonlims)
# myData.makeGEEmap()
Where’s the lake now?
scene_id='COPERNICUS/S2_SR/20191119T034629_20191119T034625_T42DWF'
fig = myData.plotDataAndMap(scene_id, crs='EPSG:3031', title='Where did the lake go?')
Data has not yet been requested from OpenAltimetry yet. Doing this now.
---> requesting ATL03 data... Done.
---> requesting ATL06 data... Done.
---> requesting ATL08 data... Done.
Downloaded downloads/COPERNICUS-S2_SR-20191119T034629_20191119T034625_T42DWF-8bitRGB.tif
Saved plot to: plots/COPERNICUS-S2_SR-20191119T034629_20191119T034625_T42DWF-8bitRGB-plot.jpg