Data integration with ICESat-2 - Part I
Contents
Data integration with ICESat-2 - Part I
Credits
Zach Fair
Ian Joughin
Tasha Snow
Learning Objectives
Goals
Identify and locate non-ICESat-2 data sets
Acquire data from the cloud or via download
Open data in
pandasandxarrayand basic functioning of DataFrames
Key Takeaway
By the end of this tutorial, you will be able to visualize Cloud Optimized Geotiffs with ICESat-2 and ATM data.
For this tutorial, feel free to run the code along with us as we live code by downsizing the zoom window and splitting your screen (or using two screens). Or you can simply watch the zoom walkthrough. Don’t worry if you fall behind on the code. The notebook is standalone and you can easily run the code at your own pace another time to catch anything you missed.
We will have one exercise you can type into a notebook, or figure out in a separate document. We will also ask some questions that you can responsd to in the tutorial Slack channel.
Computing environment
We’ll be using the following open source Python libraries in this notebook:
# Suppress library deprecation warnings
import logging
logging.captureWarnings(True)
import ipyleaflet
from ipyleaflet import Map, GeoData, LayersControl,Rectangle, basemaps, basemap_to_tiles, TileLayer, SplitMapControl, Polygon
import ipywidgets
import datetime
import re
# %matplotlib widget
import satsearch
from satsearch import Search
import geopandas as gpd
import ast
import pandas as pd
import geoviews as gv
import hvplot.pandas
from ipywidgets import interact
from IPython.display import display, Image
import intake # if you've installed intake-STAC, it will automatically import alongside intake
import xarray as xr
import matplotlib.pyplot as plt
import boto3
import rasterio as rio
from rasterio.session import AWSSession
from rasterio.plot import show
import rioxarray as rxr
from dask.utils import SerializableLock
import os
import hvplot.xarray
import numpy as np
from pyproj import Proj, transform
1. Identify and acquire the ICESat2 product(s) of interest
What is the application of this product?
What region and resolution is needed?
Download ICESat-2 ATL06 data from desired region
Remember icepyx? We are going to use that again to download some ICESat-2 ATL06 data over our region of interest.
import icepyx as ipx


# Specifying the necessary icepyx parameters
short_name = 'ATL06'
spatial_extent = 'hackweek_kml_jakobshavan.kml' # KML polygon centered on Jakobshavan
date_range = ['2019-04-01', '2019-04-30']
rgts = ['338'] # IS-2 RGT of interest
You may notice that we specified a RGT track. As seen below, a large number of ICESat-2 overpasses occur for Jakobshavan. In the interest of time (and computer memory), we are going to look at only one of these tracks.
# Show image of area of interest (data viz tutorial will get in deeper so don't explain much):
center = [69.2, -50]
zoom = 7
# Open KML file for visualizing
gpd.io.file.fiona.drvsupport.supported_drivers['KML'] = 'rw'
jk = gpd.read_file(spatial_extent, driver='KML')
m = Map(basemap=basemap_to_tiles(basemaps.NASAGIBS.ModisAquaTrueColorCR, '2020-07-18'),center=center,zoom=zoom)
geo_data = GeoData(geo_dataframe = jk)
m.add_layer(geo_data)
m.add_control(LayersControl())
m
# Setup the Query object
region = ipx.Query(short_name, spatial_extent, date_range, tracks=rgts)
# Show the available granules
region.avail_granules(ids=True)
[['ATL06_20190420093051_03380303_005_01.h5']]
Looks like we have an ICESat-2 track! Let’s quickly visualize the data to ensure that there are no clouds.
# Request information from OpenAltimetry
cyclemap, rgtmap = region.visualize_elevation()
rgtmap
Generating urls
Sending request to OpenAltimetry, please wait...
100%|██████████| 1/1 [00:00<00:00, 1.04it/s]
Plot elevation, please wait...
Looks good! Now it’s time to download the data.
# Set Earthdata credentials
uid = 'uwhackweek'
email = 'hackweekadmin@gmail.com'
region.earthdata_login(uid, email)
# Order the granules
region.order_granules()
Total number of data order requests is 1 for 1 granules.
Data request 1 of 1 is submitting to NSIDC
order ID: 5000002845921
Initial status of your order request at NSIDC is: pending
Your order status is still pending at NSIDC. Please continue waiting... this may take a few moments.
Your order status is still pending at NSIDC. Please continue waiting... this may take a few moments.
Your order status is still pending at NSIDC. Please continue waiting... this may take a few moments.
Your order status is still processing at NSIDC. Please continue waiting... this may take a few moments.
Your order is: complete
# Download the data
path = '/tmp/DataIntegration/'
region.download_granules(path)
Beginning download of zipped output...
Data request 5000002845921 of 1 order(s) is downloaded.
Download complete
import h5py
# Load the ICESat-2 data. We will just look at the central beams (GT2R/L)
is2_file = 'processed_ATL06_20190420093051_03380303_005_01_full.h5'
with h5py.File(is2_file, 'r') as f:
is2_gt2r = pd.DataFrame(data={'lat': f['gt2r/land_ice_segments/latitude'][:],
'lon': f['gt2r/land_ice_segments/longitude'][:],
'elev': f['gt2r/land_ice_segments/h_li'][:]})
is2_gt2l = pd.DataFrame(data={'lat': f['gt2l/land_ice_segments/latitude'][:],
'lon': f['gt2l/land_ice_segments/longitude'][:],
'elev': f['gt2l/land_ice_segments/h_li'][:]})
2. Identify other products of interest
Question - Respond in Slack
What research problems have you wanted to address that require more than one dataset?
Where are other data sets stored?
Cloud datasets in AWS https://registry.opendata.aws/
NASA EarthData https://search.earthdata.nasa.gov/search/
ESA Copernicus Hub https://scihub.copernicus.eu
Etc.
More on this in the Cloud Computing Tools tutorial
Today, we will show ATM (non-AWS) and Landsat (AWS)
3. Acquire non-cloud data and open: ATM data access
Why did we choose April 2019 and RGT 338? In Spring 2019, an airborne campaign called Operation IceBridge was flown across Jakobshavan as validation for ICESat-2. Onboard was the Airborne Topographic Mapper, a lidar that works at both 532 nm (like ICESat-2) and 1064 nm (near-infrared). More information about Operation IceBridge and ATM may be found here: https://nsidc.org/data/icebridge
Here, we are going to try and co-register ATM spot measurements with ICESat-2. Because both data sets are rather large, this can be computationally expensive, so we will only consider one flight track with the ATM 532 nm beam.
Operation IceBridge data is not available on the cloud, so this data was downloaded directly from NSIDC. If you are interested in using IceBridge data, NSIDC has a useful data portal here: https://nsidc.org/icebridge/portal/map
# Load the ATM data into a DataFrame
atm_file = 'ILATM2_20190506_151600_smooth_nadir3seg_50pt.csv'
atm_l2 = pd.read_csv(atm_file)
atm_l2.head()
| UTC_Seconds_Of_Day | Latitude(deg) | Longitude(deg) | WGS84_Ellipsoid_Height(m) | South-to-North_Slope | West-to-East_Slope | RMS_Fit(cm) | Number_Of_ATM_Measurments_Used | Number_Of_ATM_Measurements_Removed | Distance_Of_Block_To_The_Right_Of_Aircraft(m) | Track_Identifier | |
|---|---|---|---|---|---|---|---|---|---|---|---|
| 0 | 54969.50 | 69.262002 | 310.351764 | 490.3974 | 0.077354 | -0.069179 | 589.57 | 3723 | 5 | 78 | 1 |
| 1 | 54969.50 | 69.262065 | 310.353395 | 500.2330 | -0.048777 | 0.006024 | 434.12 | 2185 | 21 | 14 | 2 |
| 2 | 54969.50 | 69.262128 | 310.355026 | 500.3090 | 0.068798 | 0.077559 | 777.80 | 3640 | 8 | -51 | 3 |
| 3 | 54969.50 | 69.262079 | 310.353741 | 498.9152 | -0.085600 | -0.111001 | 472.64 | 2818 | 15 | 0 | 0 |
| 4 | 54969.75 | 69.261648 | 310.351873 | 487.1317 | 0.108085 | -0.078827 | 520.83 | 3753 | 33 | 78 | 1 |
We opened this data into a Pandas DataFrame, which is a handy tool for Earth data exploration and analysis. The column names derive automatically from the first row of the csv and each row corresponds to an ATM measurement.
Opening and manipulating data in Pandas
Pandas excels at helping you explore, clean, and process tabular data, such as data stored in spreadsheets or databases. In pandas, a Series is a 1-D data table and a DataFrame is the 2-D data table, which we just saw above.
read_csv, the function we used above, is the easiest way to open a csv data file into a pandas DataFrame. We can specify formatting, data selection, indexing, and much more when reading any data into a pandas DataFrame. Below we read in the data again, specifying different headers, assigning the first column as the index, and assigning the first column as the header (even though we are renaming it, so that it doesn’t mistake the first row in the csv as data).
# Load data with specific headers
headers = ['UTC', 'Lat', 'Lon',
'Height', 'South-to-North_Slope',
'West-to-East_Slope', 'RMS_Fit', 'Number_Measurements',
'Number_Measurements_Removed',
'Distance_Of_Block_To_The_Right_Of_Aircraft', 'Track_Identifier']
atm_l2 = pd.read_csv(atm_file, names=headers, index_col=0, header=0)
atm_l2.head()
| Lat | Lon | Height | South-to-North_Slope | West-to-East_Slope | RMS_Fit | Number_Measurements | Number_Measurements_Removed | Distance_Of_Block_To_The_Right_Of_Aircraft | Track_Identifier | |
|---|---|---|---|---|---|---|---|---|---|---|
| UTC | ||||||||||
| 54969.50 | 69.262002 | 310.351764 | 490.3974 | 0.077354 | -0.069179 | 589.57 | 3723 | 5 | 78 | 1 |
| 54969.50 | 69.262065 | 310.353395 | 500.2330 | -0.048777 | 0.006024 | 434.12 | 2185 | 21 | 14 | 2 |
| 54969.50 | 69.262128 | 310.355026 | 500.3090 | 0.068798 | 0.077559 | 777.80 | 3640 | 8 | -51 | 3 |
| 54969.50 | 69.262079 | 310.353741 | 498.9152 | -0.085600 | -0.111001 | 472.64 | 2818 | 15 | 0 | 0 |
| 54969.75 | 69.261648 | 310.351873 | 487.1317 | 0.108085 | -0.078827 | 520.83 | 3753 | 33 | 78 | 1 |
Now we can explore the data and DataFrame functions…
# Find out the names of the columns
atm_l2.columns
Index(['Lat', 'Lon', 'Height', 'South-to-North_Slope', 'West-to-East_Slope',
'RMS_Fit', 'Number_Measurements', 'Number_Measurements_Removed',
'Distance_Of_Block_To_The_Right_Of_Aircraft', 'Track_Identifier'],
dtype='object')
# Show data in only one of those columns
atm_l2['Lat'].head()
UTC
54969.50 69.262002
54969.50 69.262065
54969.50 69.262128
54969.50 69.262079
54969.75 69.261648
Name: Lat, dtype: float64
# Same thing, but another way
atm_l2.Lat.head()
UTC
54969.50 69.262002
54969.50 69.262065
54969.50 69.262128
54969.50 69.262079
54969.75 69.261648
Name: Lat, dtype: float64
If we want something more intuitive for our index, we can create a column of datetime objects that uses the date from the ATM file name and seconds_of_day column as date and time information.
# Reset the index
atm_l2 = atm_l2.reset_index()
# Use the date in the string of the file name to create a datetime of the date
date = pd.to_datetime(atm_file[7:15])
# Use UTC seconds_of_day column to calculate time of day that we will use to add time to the datetime
time = pd.to_timedelta(atm_l2.UTC, unit='s')
# Add the time to date and set as index
atm_l2['DateTime'] = date + time
atm_l2 = atm_l2.set_index('DateTime')
atm_l2.head()
| UTC | Lat | Lon | Height | South-to-North_Slope | West-to-East_Slope | RMS_Fit | Number_Measurements | Number_Measurements_Removed | Distance_Of_Block_To_The_Right_Of_Aircraft | Track_Identifier | |
|---|---|---|---|---|---|---|---|---|---|---|---|
| DateTime | |||||||||||
| 2019-05-06 15:16:09.500 | 54969.50 | 69.262002 | 310.351764 | 490.3974 | 0.077354 | -0.069179 | 589.57 | 3723 | 5 | 78 | 1 |
| 2019-05-06 15:16:09.500 | 54969.50 | 69.262065 | 310.353395 | 500.2330 | -0.048777 | 0.006024 | 434.12 | 2185 | 21 | 14 | 2 |
| 2019-05-06 15:16:09.500 | 54969.50 | 69.262128 | 310.355026 | 500.3090 | 0.068798 | 0.077559 | 777.80 | 3640 | 8 | -51 | 3 |
| 2019-05-06 15:16:09.500 | 54969.50 | 69.262079 | 310.353741 | 498.9152 | -0.085600 | -0.111001 | 472.64 | 2818 | 15 | 0 | 0 |
| 2019-05-06 15:16:09.750 | 54969.75 | 69.261648 | 310.351873 | 487.1317 | 0.108085 | -0.078827 | 520.83 | 3753 | 33 | 78 | 1 |
Now we can easily slice data by date, month, day, etc.
atm_l2['2019-05-06'].head()
| UTC | Lat | Lon | Height | South-to-North_Slope | West-to-East_Slope | RMS_Fit | Number_Measurements | Number_Measurements_Removed | Distance_Of_Block_To_The_Right_Of_Aircraft | Track_Identifier | |
|---|---|---|---|---|---|---|---|---|---|---|---|
| DateTime | |||||||||||
| 2019-05-06 15:16:09.500 | 54969.50 | 69.262002 | 310.351764 | 490.3974 | 0.077354 | -0.069179 | 589.57 | 3723 | 5 | 78 | 1 |
| 2019-05-06 15:16:09.500 | 54969.50 | 69.262065 | 310.353395 | 500.2330 | -0.048777 | 0.006024 | 434.12 | 2185 | 21 | 14 | 2 |
| 2019-05-06 15:16:09.500 | 54969.50 | 69.262128 | 310.355026 | 500.3090 | 0.068798 | 0.077559 | 777.80 | 3640 | 8 | -51 | 3 |
| 2019-05-06 15:16:09.500 | 54969.50 | 69.262079 | 310.353741 | 498.9152 | -0.085600 | -0.111001 | 472.64 | 2818 | 15 | 0 | 0 |
| 2019-05-06 15:16:09.750 | 54969.75 | 69.261648 | 310.351873 | 487.1317 | 0.108085 | -0.078827 | 520.83 | 3753 | 33 | 78 | 1 |
Or by a range of dates
atm_l2['2019-05-06':'2019-05-07']
| UTC | Lat | Lon | Height | South-to-North_Slope | West-to-East_Slope | RMS_Fit | Number_Measurements | Number_Measurements_Removed | Distance_Of_Block_To_The_Right_Of_Aircraft | Track_Identifier | |
|---|---|---|---|---|---|---|---|---|---|---|---|
| DateTime | |||||||||||
| 2019-05-06 15:16:09.500 | 54969.50 | 69.262002 | 310.351764 | 490.3974 | 0.077354 | -0.069179 | 589.57 | 3723 | 5 | 78 | 1 |
| 2019-05-06 15:16:09.500 | 54969.50 | 69.262065 | 310.353395 | 500.2330 | -0.048777 | 0.006024 | 434.12 | 2185 | 21 | 14 | 2 |
| 2019-05-06 15:16:09.500 | 54969.50 | 69.262128 | 310.355026 | 500.3090 | 0.068798 | 0.077559 | 777.80 | 3640 | 8 | -51 | 3 |
| 2019-05-06 15:16:09.500 | 54969.50 | 69.262079 | 310.353741 | 498.9152 | -0.085600 | -0.111001 | 472.64 | 2818 | 15 | 0 | 0 |
| 2019-05-06 15:16:09.750 | 54969.75 | 69.261648 | 310.351873 | 487.1317 | 0.108085 | -0.078827 | 520.83 | 3753 | 33 | 78 | 1 |
| ... | ... | ... | ... | ... | ... | ... | ... | ... | ... | ... | ... |
| 2019-05-06 15:16:57.250 | 55017.25 | 69.198390 | 310.375657 | 213.3556 | 0.070125 | 0.036402 | 446.26 | 2120 | 11 | 0 | 0 |
| 2019-05-06 15:16:57.500 | 55017.50 | 69.197981 | 310.373687 | 212.8147 | 0.080339 | 0.024375 | 462.73 | 3759 | 31 | 83 | 1 |
| 2019-05-06 15:16:57.500 | 55017.50 | 69.198079 | 310.375722 | 211.2819 | 0.059184 | 0.013959 | 465.01 | 2112 | 12 | 2 | 2 |
| 2019-05-06 15:16:57.500 | 55017.50 | 69.198177 | 310.377757 | 212.7269 | 0.049178 | -0.010615 | 391.37 | 3488 | 36 | -79 | 3 |
| 2019-05-06 15:16:57.500 | 55017.50 | 69.198081 | 310.375774 | 211.2959 | 0.061987 | 0.022402 | 453.97 | 2071 | 16 | 0 | 0 |
771 rows × 11 columns
Slicing
Two methods for slicing:
.loc for label-based indexing
.iloc for positional indexing
Use loc to slice specific indices
atm_l2.index
DatetimeIndex(['2019-05-06 15:16:09.500000', '2019-05-06 15:16:09.500000',
'2019-05-06 15:16:09.500000', '2019-05-06 15:16:09.500000',
'2019-05-06 15:16:09.750000', '2019-05-06 15:16:09.750000',
'2019-05-06 15:16:09.750000', '2019-05-06 15:16:09.750000',
'2019-05-06 15:16:10', '2019-05-06 15:16:10',
...
'2019-05-06 15:16:57', '2019-05-06 15:16:57',
'2019-05-06 15:16:57.250000', '2019-05-06 15:16:57.250000',
'2019-05-06 15:16:57.250000', '2019-05-06 15:16:57.250000',
'2019-05-06 15:16:57.500000', '2019-05-06 15:16:57.500000',
'2019-05-06 15:16:57.500000', '2019-05-06 15:16:57.500000'],
dtype='datetime64[ns]', name='DateTime', length=771, freq=None)
atm_l2.loc['2019-05-06 15:16:09.500']
| UTC | Lat | Lon | Height | South-to-North_Slope | West-to-East_Slope | RMS_Fit | Number_Measurements | Number_Measurements_Removed | Distance_Of_Block_To_The_Right_Of_Aircraft | Track_Identifier | |
|---|---|---|---|---|---|---|---|---|---|---|---|
| DateTime | |||||||||||
| 2019-05-06 15:16:09.500 | 54969.5 | 69.262002 | 310.351764 | 490.3974 | 0.077354 | -0.069179 | 589.57 | 3723 | 5 | 78 | 1 |
| 2019-05-06 15:16:09.500 | 54969.5 | 69.262065 | 310.353395 | 500.2330 | -0.048777 | 0.006024 | 434.12 | 2185 | 21 | 14 | 2 |
| 2019-05-06 15:16:09.500 | 54969.5 | 69.262128 | 310.355026 | 500.3090 | 0.068798 | 0.077559 | 777.80 | 3640 | 8 | -51 | 3 |
| 2019-05-06 15:16:09.500 | 54969.5 | 69.262079 | 310.353741 | 498.9152 | -0.085600 | -0.111001 | 472.64 | 2818 | 15 | 0 | 0 |
Select indices and columns
atm_l2.loc['2019-05-06 15:16:09.500', ['Lat', 'Lon', 'Height']]
| Lat | Lon | Height | |
|---|---|---|---|
| DateTime | |||
| 2019-05-06 15:16:09.500 | 69.262002 | 310.351764 | 490.3974 |
| 2019-05-06 15:16:09.500 | 69.262065 | 310.353395 | 500.2330 |
| 2019-05-06 15:16:09.500 | 69.262128 | 310.355026 | 500.3090 |
| 2019-05-06 15:16:09.500 | 69.262079 | 310.353741 | 498.9152 |
Use iloc to select by row and column number
atm_l2.iloc[[0,1],[2,3,4]]
| Lon | Height | South-to-North_Slope | |
|---|---|---|---|
| DateTime | |||
| 2019-05-06 15:16:09.500 | 310.351764 | 490.3974 | 0.077354 |
| 2019-05-06 15:16:09.500 | 310.353395 | 500.2330 | -0.048777 |
Statistical manipulations
Say we want to know the mean ATM height for the data…
atm_l2['Height'].mean()
270.60600557717254
atm_l2['Height'].describe()
count 771.000000
mean 270.606006
std 115.970329
min 82.582400
25% 182.211950
50% 231.822500
75% 346.061800
max 506.778400
Name: Height, dtype: float64
atm_l2['Number_Measurements'].sum()
2178525
If we want to know the mean of each column grouped for each Track Identifier…
# Group rows together by a column and take the mean of each group
atm_l2.groupby('Track_Identifier').mean()
| UTC | Lat | Lon | Height | South-to-North_Slope | West-to-East_Slope | RMS_Fit | Number_Measurements | Number_Measurements_Removed | Distance_Of_Block_To_The_Right_Of_Aircraft | |
|---|---|---|---|---|---|---|---|---|---|---|
| Track_Identifier | ||||||||||
| 0 | 54993.50000 | 69.229326 | 310.364939 | 273.940858 | 0.052332 | 0.112684 | 528.128653 | 2166.176166 | 21.186528 | 0.000000 |
| 1 | 54993.50000 | 69.229204 | 310.362120 | 257.611426 | 0.061328 | 0.191712 | 526.484093 | 3515.626943 | 28.321244 | 111.932642 |
| 2 | 54993.40625 | 69.229421 | 310.364227 | 271.031019 | 0.053800 | 0.107376 | 523.098750 | 2088.322917 | 22.244792 | 26.671875 |
| 3 | 54993.50000 | 69.229390 | 310.366413 | 279.842922 | 0.050348 | 0.088295 | 537.783316 | 3528.388601 | 21.300518 | -58.575130 |
Groupby is pretty complex. You can dive deeper here: https://pandas.pydata.org/docs/reference/api/pandas.DataFrame.groupby.html
You can also resample your data to get the mean of all measurements at 30 second intervals…
atm_l2.resample('30S').mean()
| UTC | Lat | Lon | Height | South-to-North_Slope | West-to-East_Slope | RMS_Fit | Number_Measurements | Number_Measurements_Removed | Distance_Of_Block_To_The_Right_Of_Aircraft | Track_Identifier | |
|---|---|---|---|---|---|---|---|---|---|---|---|
| DateTime | |||||||||||
| 2019-05-06 15:16:00 | 54979.625000 | 69.247859 | 310.358014 | 372.339821 | 0.121164 | 0.140131 | 525.717805 | 2918.50000 | 28.612805 | 20.448171 | 1.500000 |
| 2019-05-06 15:16:30 | 55003.732506 | 69.215620 | 310.369172 | 195.281646 | 0.005060 | 0.113866 | 531.223386 | 2756.78781 | 19.304740 | 19.665914 | 1.498871 |
To use your own functions, one might first try to use a for loop to iterate over rows or columns of data. Pandas has made an easy and fast alternative, apply(). This function acts as a map() function in Python. It takes a function as an input and applies the function to an entire DataFrame.
Something easy could be to take the median of each column of the data. We specify the np.median function and axis=0 to pass in all rows and iterate over each column.
atm_l2.apply(np.median, axis=0)
UTC 54993.500000
Lat 69.228910
Lon 310.365003
Height 231.822500
South-to-North_Slope 0.044511
West-to-East_Slope 0.108179
RMS_Fit 513.780000
Number_Measurements 3121.000000
Number_Measurements_Removed 14.000000
Distance_Of_Block_To_The_Right_Of_Aircraft 0.000000
Track_Identifier 1.000000
dtype: float64
Say you want to use only specific rows or columns in your function. For instance, you want to know the total number of measurements (i.e. Number_Measurements + Number_Measurements_Removed). We already have a function that takes two columns and adds them together. Now we want to apply it to the data.
First, we call the .apply() method on the atm_l2 dataframe. Then use the lambda function to iterate over the rows (or columns) of the dataframe. For every row, we grab the Number_Measurements and Number_Measurements_Removed columns and pass them to the calc_total function. Finally, we specify the axis=1 to tell the .apply() method that we are passing in columns to apply the function to each row.
def calc_total(a,b):
total = a + b
return total
atm_l2['Total_Measurements'] = atm_l2.apply(lambda row: calc_total(row['Number_Measurements'], row['Number_Measurements_Removed']), axis=1)
atm_l2.head()
| UTC | Lat | Lon | Height | South-to-North_Slope | West-to-East_Slope | RMS_Fit | Number_Measurements | Number_Measurements_Removed | Distance_Of_Block_To_The_Right_Of_Aircraft | Track_Identifier | Total_Measurements | |
|---|---|---|---|---|---|---|---|---|---|---|---|---|
| DateTime | ||||||||||||
| 2019-05-06 15:16:09.500 | 54969.50 | 69.262002 | 310.351764 | 490.3974 | 0.077354 | -0.069179 | 589.57 | 3723 | 5 | 78 | 1 | 3728.0 |
| 2019-05-06 15:16:09.500 | 54969.50 | 69.262065 | 310.353395 | 500.2330 | -0.048777 | 0.006024 | 434.12 | 2185 | 21 | 14 | 2 | 2206.0 |
| 2019-05-06 15:16:09.500 | 54969.50 | 69.262128 | 310.355026 | 500.3090 | 0.068798 | 0.077559 | 777.80 | 3640 | 8 | -51 | 3 | 3648.0 |
| 2019-05-06 15:16:09.500 | 54969.50 | 69.262079 | 310.353741 | 498.9152 | -0.085600 | -0.111001 | 472.64 | 2818 | 15 | 0 | 0 | 2833.0 |
| 2019-05-06 15:16:09.750 | 54969.75 | 69.261648 | 310.351873 | 487.1317 | 0.108085 | -0.078827 | 520.83 | 3753 | 33 | 78 | 1 | 3786.0 |
Exercise
Try making .apply work with this new function to create a new column, Distance_to_Jakobshavn, using the Lat and Lon columns as inputs. We’ve already supplied the function, which requires a latitude and longitude input to calculate the distance between the ATM measurement and a specified point on the Jakobshavn Glacier ice front (jlat/jlon). Complete the line that applies the function to those columns in the data to get the Distance_to_Jakobshavn.
from math import sin, cos, sqrt, atan2, radians
def distance(a,b):
'''
Calculate distance between a set point and a lat lon pair from the data
a = lat
b = lon
'''
jlat,jlon = 69.2330, -49.2434
# approximate radius of earth in km
R = 6373.0
lat1 = radians(jlat)
lon1 = radians(jlon)
lat2 = radians(a)
lon2 = radians(b)
dlon = lon2 - lon1
dlat = lat2 - lat1
a = sin(dlat / 2)**2 + cos(lat1) * cos(lat2) * sin(dlon / 2)**2
c = 2 * atan2(sqrt(a), sqrt(1 - a))
distance = R * c
return distance
atm_l2['Distance_to_Jakobshavn'] = .....
atm_l2.head()
Input In [31]
atm_l2['Distance_to_Jakobshavn'] = .....
^
SyntaxError: invalid syntax
Great work! Now let’s reset the index to start fresh for multi-indexing.
atm_l2 = atm_l2.reset_index()
atm_l2.head()
| DateTime | UTC | Lat | Lon | Height | South-to-North_Slope | West-to-East_Slope | RMS_Fit | Number_Measurements | Number_Measurements_Removed | Distance_Of_Block_To_The_Right_Of_Aircraft | Track_Identifier | Total_Measurements | |
|---|---|---|---|---|---|---|---|---|---|---|---|---|---|
| 0 | 2019-05-06 15:16:09.500 | 54969.50 | 69.262002 | 310.351764 | 490.3974 | 0.077354 | -0.069179 | 589.57 | 3723 | 5 | 78 | 1 | 3728.0 |
| 1 | 2019-05-06 15:16:09.500 | 54969.50 | 69.262065 | 310.353395 | 500.2330 | -0.048777 | 0.006024 | 434.12 | 2185 | 21 | 14 | 2 | 2206.0 |
| 2 | 2019-05-06 15:16:09.500 | 54969.50 | 69.262128 | 310.355026 | 500.3090 | 0.068798 | 0.077559 | 777.80 | 3640 | 8 | -51 | 3 | 3648.0 |
| 3 | 2019-05-06 15:16:09.500 | 54969.50 | 69.262079 | 310.353741 | 498.9152 | -0.085600 | -0.111001 | 472.64 | 2818 | 15 | 0 | 0 | 2833.0 |
| 4 | 2019-05-06 15:16:09.750 | 54969.75 | 69.261648 | 310.351873 | 487.1317 | 0.108085 | -0.078827 | 520.83 | 3753 | 33 | 78 | 1 | 3786.0 |
Multi-indexing
Multi-level indexing opens the door to more sophisticated data analysis and manipulation, especially for working with higher dimensional data. In essence, it enables you to store and manipulate data with an arbitrary number of dimensions in lower dimensional data structures like Series (1d) and DataFrame (2d).
Here, we will demonstrate a few basic things you can do with MultiIndexing. If we wanted to think about our data by DateTime and then by Track Identifier, we would set both columns as indices…
atm_l2 = atm_l2.set_index(['DateTime','Track_Identifier']).sort_index()
atm_l2
| UTC | Lat | Lon | Height | South-to-North_Slope | West-to-East_Slope | RMS_Fit | Number_Measurements | Number_Measurements_Removed | Distance_Of_Block_To_The_Right_Of_Aircraft | Total_Measurements | ||
|---|---|---|---|---|---|---|---|---|---|---|---|---|
| DateTime | Track_Identifier | |||||||||||
| 2019-05-06 15:16:09.500 | 0 | 54969.50 | 69.262079 | 310.353741 | 498.9152 | -0.085600 | -0.111001 | 472.64 | 2818 | 15 | 0 | 2833.0 |
| 1 | 54969.50 | 69.262002 | 310.351764 | 490.3974 | 0.077354 | -0.069179 | 589.57 | 3723 | 5 | 78 | 3728.0 | |
| 2 | 54969.50 | 69.262065 | 310.353395 | 500.2330 | -0.048777 | 0.006024 | 434.12 | 2185 | 21 | 14 | 2206.0 | |
| 3 | 54969.50 | 69.262128 | 310.355026 | 500.3090 | 0.068798 | 0.077559 | 777.80 | 3640 | 8 | -51 | 3648.0 | |
| 2019-05-06 15:16:09.750 | 0 | 54969.75 | 69.261725 | 310.353850 | 500.6826 | -0.027762 | -0.056691 | 446.38 | 2732 | 30 | 0 | 2762.0 |
| ... | ... | ... | ... | ... | ... | ... | ... | ... | ... | ... | ... | ... |
| 2019-05-06 15:16:57.250 | 3 | 55017.25 | 69.198486 | 310.377647 | 215.1597 | 0.056693 | -0.040250 | 448.01 | 3462 | 8 | -79 | 3470.0 |
| 2019-05-06 15:16:57.500 | 0 | 55017.50 | 69.198081 | 310.375774 | 211.2959 | 0.061987 | 0.022402 | 453.97 | 2071 | 16 | 0 | 2087.0 |
| 1 | 55017.50 | 69.197981 | 310.373687 | 212.8147 | 0.080339 | 0.024375 | 462.73 | 3759 | 31 | 83 | 3790.0 | |
| 2 | 55017.50 | 69.198079 | 310.375722 | 211.2819 | 0.059184 | 0.013959 | 465.01 | 2112 | 12 | 2 | 2124.0 | |
| 3 | 55017.50 | 69.198177 | 310.377757 | 212.7269 | 0.049178 | -0.010615 | 391.37 | 3488 | 36 | -79 | 3524.0 |
771 rows × 11 columns
For some terminology, the levels of a MultiIndex are the former column names (UTC, Track_Identifier). The labels are the actual values in a level, (2019-05-06 15:16:09.500, 0-3, …). Levels can be referred to by name or position, with 0 being the outermost level.
Slicing the outermost index level is pretty easy, we just use our regular .loc[row_indexer, column_indexer] to grab a couple datetimes we want. We’ll select the columns Lat and Lon where the UTC was 2019-05-06 15:16:09.500 and 2019-05-06 15:16:09.750.
atm_l2.loc['2019-05-06 15:16:09.500',['Lat','Lon']]
| Lat | Lon | |
|---|---|---|
| Track_Identifier | ||
| 0 | 69.262079 | 310.353741 |
| 1 | 69.262002 | 310.351764 |
| 2 | 69.262065 | 310.353395 |
| 3 | 69.262128 | 310.355026 |
If you wanted to select the rows whose track was 0 or 1, .loc wants [row_indexer, column_indexer] so let’s wrap the two elements of our row indexer (the list of UTCs and the Tracks) in a tuple to make it a single unit:
atm_l2.loc[('2019-05-06 15:16:09.500',[0,1]),['Lat','Lon']]
| Lat | Lon | ||
|---|---|---|---|
| DateTime | Track_Identifier | ||
| 2019-05-06 15:16:09.500 | 0 | 69.262079 | 310.353741 |
| 1 | 69.262002 | 310.351764 |
Now you want info from any UTC but for the specific tracks again (0,1). Below the : indicates all labels in this level.
atm_l2.loc[pd.IndexSlice[:,[0,1]], ['Lat','Lon']]
| Lat | Lon | ||
|---|---|---|---|
| DateTime | Track_Identifier | ||
| 2019-05-06 15:16:09.500 | 0 | 69.262079 | 310.353741 |
| 1 | 69.262002 | 310.351764 | |
| 2019-05-06 15:16:09.750 | 0 | 69.261725 | 310.353850 |
| 1 | 69.261648 | 310.351873 | |
| 2019-05-06 15:16:10.000 | 0 | 69.261371 | 310.353959 |
| ... | ... | ... | ... |
| 2019-05-06 15:16:57.000 | 1 | 69.198599 | 310.373444 |
| 2019-05-06 15:16:57.250 | 0 | 69.198390 | 310.375657 |
| 1 | 69.198292 | 310.373612 | |
| 2019-05-06 15:16:57.500 | 0 | 69.198081 | 310.375774 |
| 1 | 69.197981 | 310.373687 |
386 rows × 2 columns
You can do a lot with groupby, pivoting, and reshaping, but I won’t dive into that in this tutorial. You can check out more here: https://pandas.pydata.org/pandas-docs/stable/user_guide/advanced.html
Now that we are oriented with the pandas DataFrame, let’s get back to the ATM data we have opened and co-register it with the ICESat-2 lines.
Co-register ICESat-2 with ATM data
# Load the ATM data into a DataFrame
atm_file = 'ILATM2_20190506_151600_smooth_nadir3seg_50pt.csv'
atm_l2 = pd.read_csv(atm_file)
atm_l2.head()
| UTC_Seconds_Of_Day | Latitude(deg) | Longitude(deg) | WGS84_Ellipsoid_Height(m) | South-to-North_Slope | West-to-East_Slope | RMS_Fit(cm) | Number_Of_ATM_Measurments_Used | Number_Of_ATM_Measurements_Removed | Distance_Of_Block_To_The_Right_Of_Aircraft(m) | Track_Identifier | |
|---|---|---|---|---|---|---|---|---|---|---|---|
| 0 | 54969.50 | 69.262002 | 310.351764 | 490.3974 | 0.077354 | -0.069179 | 589.57 | 3723 | 5 | 78 | 1 |
| 1 | 54969.50 | 69.262065 | 310.353395 | 500.2330 | -0.048777 | 0.006024 | 434.12 | 2185 | 21 | 14 | 2 |
| 2 | 54969.50 | 69.262128 | 310.355026 | 500.3090 | 0.068798 | 0.077559 | 777.80 | 3640 | 8 | -51 | 3 |
| 3 | 54969.50 | 69.262079 | 310.353741 | 498.9152 | -0.085600 | -0.111001 | 472.64 | 2818 | 15 | 0 | 0 |
| 4 | 54969.75 | 69.261648 | 310.351873 | 487.1317 | 0.108085 | -0.078827 | 520.83 | 3753 | 33 | 78 | 1 |
The ATM L2 file contains plenty of information, including surface height estimates and slope of the local topography. It also contains a track identifier - ATM takes measurements from multiple parts of the aircraft, namely starboard, port, and nadir. To keep things simple, we will filter the DataFrame to only look at the nadir track (Track_Identifier = 0).
atm_l2 = atm_l2[atm_l2['Track_Identifier']==0]
# Change the longitudes to be consistent with ICESat-2
atm_l2['Longitude(deg)'] -= 360
print(atm_l2.size)
2123
Let’s take a quick look at where ATM is relative to ICESat-2…
# Subset the ICESat-2 data to the ATM latitudes
is2_gt2r = is2_gt2r[(is2_gt2r['lat']<atm_l2['Latitude(deg)'].max()) & (is2_gt2r['lat']>atm_l2['Latitude(deg)'].min())]
is2_gt2l = is2_gt2l[(is2_gt2l['lat']<atm_l2['Latitude(deg)'].max()) & (is2_gt2l['lat']>atm_l2['Latitude(deg)'].min())]
# Set up a map with the flight tracks as overlays
from ipyleaflet import Map, basemaps, basemap_to_tiles, Polyline
m = Map(
basemap=basemap_to_tiles(basemaps.Esri.WorldImagery),
center=(69.25, 310.35-360),
zoom=10
)
gt2r_line = Polyline(
locations=[
[is2_gt2r['lat'].min(), is2_gt2r['lon'].max()],
[is2_gt2r['lat'].max(), is2_gt2r['lon'].min()]
],
color="green" ,
fill=False
)
m.add_layer(gt2r_line)
gt2l_line = Polyline(
locations=[
[is2_gt2l['lat'].min(), is2_gt2l['lon'].max()],
[is2_gt2l['lat'].max(), is2_gt2l['lon'].min()]
],
color="green" ,
fill=False
)
m.add_layer(gt2l_line)
atm_line = Polyline(
locations=[
[atm_l2['Latitude(deg)'].min(), atm_l2['Longitude(deg)'].max()],
[atm_l2['Latitude(deg)'].max(), atm_l2['Longitude(deg)'].min()]
],
color="orange" ,
fill=False
)
m.add_layer(atm_line)
m
Looks like ATM aligns very closely with the left beam (GT2L), so hopefully the two beams will agree. The terrain over this region is quite rough, so we may expect some differences between ATM and GT2R. ICESat-2 also flew over Jakobshavan 16 days before ATM, so there might be slight differences due to ice movement.
We have looked at how we can quickly download ICESat-2 and airborne lidar data, and process them using pandas. We will engage in a more thorough analysis in the Data Integration session tomorrow.
3. Search and open (Landsat) raster imagery from the cloud
Let’s now talk about cloud-optimized approaches that require no downloading to search and access the data.
Cloud optimized approaches
Organize data as an aggregation of small, independently retrievable objects (e.g., zarr, HDF2, Geotiff in the Cloud)
Allow access to pieces of large objects (e.g., Cloud-Optimized GeoTIFF3, OPeNDAP4 in the Cloud)
We will be working with Cloud Optimized GeoTIFF (COG). A COG is a GeoTIFF file with an internal organization that enables more efficient workflows by allowing us to ask for just the parts of a file we need, instead of having to open the entire image or data set (see more at https://www.cogeo.org/).
Example url for accessing a band in the cloud from an S3 bucket:
s3://usgs-landsat/collection02/level-2/standard/oli-tirs/2020/202/025/LC08_L1TP_202025_20190420_20190507_01_T1/LC08_L1TP_202025_20190420_20190507_01_T1_B4.TIF
User Manual for more information about accessing Landsat S3:
https://d9-wret.s3.us-west-2.amazonaws.com/assets/palladium/production/s3fs-public/atoms/files/LSDS-2032-Landsat-Commercial-Cloud-Direct-Access-Users-Guide-v2.pdf.pdf
Search for Landsat imagery
To explore and access COG’s easily we will use a SpatioTemporal Asset Catalog (STAC). The STAC provides a common metadata format to make it easier to index and querrying S3 buckets for geospatial data. Learn more here: https://github.com/radiantearth/stac-spec.
# Sets up credentials for acquiring images through dask/xarray
os.environ["AWS_REQUEST_PAYER"] = "requester"
# Sets up proper credentials for acquiring data through rasterio
aws_session = AWSSession(boto3.Session(), requester_pays=True)
Extract geometry bounds from the ICESat-2 KML file used above so that we can perform the Landsat spatial search.
# Extract geometry bounds
geom = jk.geometry[0]
print(geom.bounds)
(-51.3229009069365, 68.84029223511094, -48.20366423696812, 69.61656633135274)
We will search for imagery in STAC catalog using satsearch: https://github.com/sat-utils/sat-search
# Search STAC API for Landsat images based on a bounding box, date and other metadata if desired
bbox = (geom.bounds[0], geom.bounds[1], geom.bounds[2], geom.bounds[3]) #(west, south, east, north)
timeRange = '2019-05-06/2019-05-07'
results = Search.search(url='https://ibhoyw8md9.execute-api.us-west-2.amazonaws.com/prod',
collection='usgs-landsat/collection02/',
datetime=timeRange,
bbox=bbox,
# properties=properties,
sort=['<datetime'])
print('%s items' % results.found())
items = results.items()
# Save search to geojson file
gjson_outfile = f'/home/jovyan/website2022/book/tutorials/DataIntegration/Landsat.geojson'
items.save(gjson_outfile)
6 items
We can include property searches, such as path, row, cloud-cover, as well with the properties flag.
We are given a satsearch collection of items (images)
items
<satstac.itemcollection.ItemCollection at 0x7f119f27fe20>
Load the geojson file into geopandas and inspect the items we want to collect
# Load the geojson file
gf = gpd.read_file(gjson_outfile)
gf.head(2)
| id | datetime | eo:cloud_cover | view:sun_azimuth | view:sun_elevation | platform | view:off_nadir | landsat:cloud_cover_land | landsat:wrs_type | landsat:wrs_path | landsat:wrs_row | landsat:scene_id | landsat:collection_category | landsat:collection_number | landsat:correction | proj:epsg | created | updated | geometry | |
|---|---|---|---|---|---|---|---|---|---|---|---|---|---|---|---|---|---|---|---|
| 0 | LC08_L1TP_008012_20190507_20200829_02_T1 | 2019-05-07T14:54:18.865854+00:00 | 0.18 | 173.852645 | 38.463606 | LANDSAT_8 | 0 | 0.0 | 2 | 008 | 012 | LC80080122019127LGN00 | T1 | 02 | L1TP | 32622 | 2021-07-24T04:02:59.258999+00:00 | 2021-07-24T04:02:59.258999+00:00 | POLYGON ((-50.65493 69.41549, -52.45035 67.796... |
| 1 | LC08_L2SP_008012_20190507_20200829_02_T1_SR | 2019-05-07T14:54:18.865854+00:00 | 0.18 | 173.852645 | 38.463606 | LANDSAT_8 | 0 | 0.0 | 2 | 008 | 012 | LC80080122019127LGN00 | T1 | 02 | L2SP | 32622 | 2021-07-24T04:03:48.757000+00:00 | 2021-07-24T04:03:48.757000+00:00 | POLYGON ((-50.65493 69.41549, -52.45035 67.796... |
# Plot search area of interest and frames on a map using Holoviz Libraries (more on these later)
cols = gf.loc[:,('id','landsat:wrs_path','landsat:wrs_row','geometry')]
footprints = cols.hvplot(geo=True, line_color='k', hover_cols=['landsat:wrs_path','landsat:wrs_row'], alpha=0.2, title='Landsat 8 T1',tiles='ESRI')
tiles = gv.tile_sources.CartoEco.options(width=700, height=500)
labels = gv.tile_sources.StamenLabels.options(level='annotation')
tiles * footprints * labels
Intake all scenes using the intake-STAC library
Intake-STAC facilitates discovering, exploring, and loading spatio-temporal datasets by providing Intake Drivers for STAC catalogs. This provides a simple toolkit for working with STAC catalogs and for loading STAC assets as xarray objects.
catalog = intake.open_stac_item_collection(items)
list(catalog)
['LC08_L1TP_008012_20190507_20200829_02_T1',
'LC08_L2SP_008012_20190507_20200829_02_T1_SR',
'LC08_L2SP_008012_20190507_20200829_02_T1_ST',
'LC08_L1TP_008011_20190507_20200828_02_T1',
'LC08_L2SP_008011_20190507_20200828_02_T1_SR',
'LC08_L2SP_008011_20190507_20200828_02_T1_ST']
Let’s explore the metadata and keys for the first scene
sceneids = list(catalog)
item3 = catalog[sceneids[3]]
# item3.metadata
for keys in item3.keys():
print (keys)
thumbnail
reduced_resolution_browse
index
coastal
blue
green
red
nir08
swir16
swir22
pan
cirrus
lwir11
lwir12
ANG.txt
MTL.txt
MTL.xml
MTL.json
qa_pixel
qa_radsat
VAA
VZA
SAA
SZA
We can explore the metadata for any of these:
item3['blue'].metadata
{'title': 'Blue Band (B2)',
'description': 'Collection 2 Level-1 Blue Band (B2) Top of Atmosphere Radiance',
'type': 'image/vnd.stac.geotiff; cloud-optimized=true',
'roles': ['data'],
'eo:bands': [{'name': 'B2',
'common_name': 'blue',
'gsd': 30,
'center_wavelength': 0.48}],
'href': 'https://landsatlook.usgs.gov/data/collection02/level-1/standard/oli-tirs/2019/008/011/LC08_L1TP_008011_20190507_20200828_02_T1/LC08_L1TP_008011_20190507_20200828_02_T1_B2.TIF',
'alternate': {'s3': {'storage:platform': 'AWS',
'storage:requester_pays': True,
'href': 's3://usgs-landsat/collection02/level-1/standard/oli-tirs/2019/008/011/LC08_L1TP_008011_20190507_20200828_02_T1/LC08_L1TP_008011_20190507_20200828_02_T1_B2.TIF'}},
'file:checksum': '1340f0a602019909fbb3e6bd909443ef7f9adfe7efabc86586f6e5f85e941aab30f03adbde671e000852b535ce627d864c1e6c3b33011a907b9a67fa1b7e595d9f42',
'plots': {'geotiff': {'kind': 'image',
'x': 'x',
'y': 'y',
'frame_width': 500,
'data_aspect': 1,
'rasterize': True,
'dynamic': True,
'cmap': 'viridis'}},
'catalog_dir': ''}
# This is the url needed to grab data from the S3 bucket
# From the satsearch catalog:
items[3].asset('blue')['alternate']['s3']['href'] # can use item asset name or title (blue or B2)
# From the intake-STAC catalog
item3.blue.metadata['alternate']['s3']['href'] # must use item asset name (blue)
's3://usgs-landsat/collection02/level-1/standard/oli-tirs/2019/008/011/LC08_L1TP_008011_20190507_20200828_02_T1/LC08_L1TP_008011_20190507_20200828_02_T1_B2.TIF'
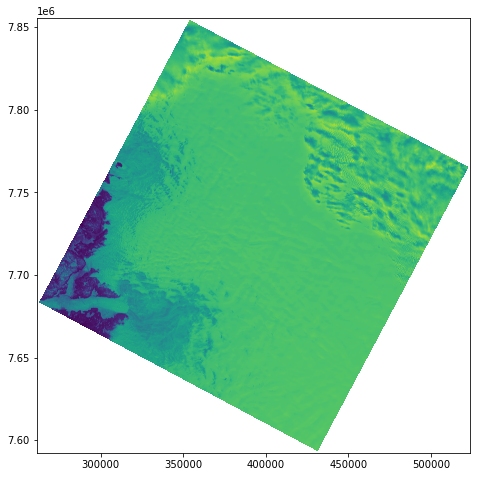
Open and visualize each image using RasterIO
import rasterio as rio
# Retrieve first scene using rio
item_url = item3.blue.metadata['alternate']['s3']['href']
# Read and plot with grid coordinates
with rio.Env(aws_session):
with rio.open(item_url) as src:
fig, ax = plt.subplots(figsize=(9,8))
# To plot
show(src,1)
# To open data into a numpy array
profile = src.profile
arr = src.read(1)
We can open directly into xarray using rasterIO…
Manipulating data in Xarray
Pandas and xarray have very similar structures and ways of manipulating data, but pandas excels with 2-D data and xarray is ideal for higher dimension data. Xarray introduces labels in the form of dimensions, coordinates and attributes on top of Pandas-like DataFrames.
Xarray has 2 fundamental data structures:
DataArray, which holds single multi-dimensional variables and its coordinatesDataset, which holds multiple variables that potentially share the same coordinates

We will only scratch the surface here on what xarray can do. To learn more, there are great xarray tutorials here: https://xarray-contrib.github.io/xarray-tutorial/online-tutorial-series/01_xarray_fundamentals.html
RasterIO and RioXarray
We can use rasterIO to easily open into an xarray DataArray:
rastxr = xr.open_dataarray(item_url,engine='rasterio')
rastxr
<xarray.DataArray 'band_data' (band: 1, y: 8771, x: 8741)>
[76667311 values with dtype=float32]
Coordinates:
* band (band) int64 1
* x (x) float64 2.613e+05 2.613e+05 ... 5.235e+05 5.235e+05
* y (y) float64 7.856e+06 7.855e+06 ... 7.592e+06 7.592e+06
spatial_ref int64 0Or a DataSet:
rastxr = xr.open_dataset(item_url,engine='rasterio')
rastxr
<xarray.Dataset>
Dimensions: (band: 1, x: 8741, y: 8771)
Coordinates:
* band (band) int64 1
* x (x) float64 2.613e+05 2.613e+05 ... 5.235e+05 5.235e+05
* y (y) float64 7.856e+06 7.855e+06 ... 7.592e+06 7.592e+06
spatial_ref int64 0
Data variables:
band_data (band, y, x) float32 ...We can open using rioxarray, which integrates rasterIO and xarray and is the most efficient way of opening using rasterIO:
import rioxarray as rxr
rastrxr = rxr.open_rasterio(item_url)
rastrxr
<xarray.DataArray (band: 1, y: 8771, x: 8741)>
[76667311 values with dtype=uint16]
Coordinates:
* band (band) int64 1
* x (x) float64 2.613e+05 2.613e+05 ... 5.235e+05 5.235e+05
* y (y) float64 7.856e+06 7.855e+06 ... 7.592e+06 7.592e+06
spatial_ref int64 0
Attributes:
_FillValue: 0.0
scale_factor: 1.0
add_offset: 0.0We can see Attributes have been added to the Xarray using the same url.
Beyond what xarray and rasterIO provide, rioxarray has these added benefits (plus others):
Supports multidimensional datasets such as netCDF
Loads in the CRS, transform, and nodata metadata in standard CF & GDAL locations
Supports masking and scaling data
Loads raster metadata into the attributes
For more info: https://corteva.github.io/rioxarray/stable/index.html
Dask
Another convenient means for opening a lot of raster data into xarray is using dask. Xarray integrates with Dask to support parallel computations and streaming computation on datasets that don’t fit into memory. So this is perfect when you want to process a lot of data.
Dask divides arrays into many small pieces, called chunks, each of which is presumed to be small enough to fit into memory.
Unlike NumPy, which has eager evaluation, operations on dask arrays are lazy. Operations queue up a series of tasks mapped over blocks, and no computation is performed until you actually ask values to be computed (e.g., to print results to your screen or write to disk). At that point, data is loaded into memory and computation proceeds in a streaming fashion, block-by-block.
More on Dask in the Cloud Computing Tools tutorial.
To expand our xarray toolbox for working with larger data sets that we don’t necessarily want entirely in memory, we will start by reading in 3 bands of a Landsat scene to xarray using dask.
sceneid = catalog[sceneids[0]]
print (sceneid.name)
band_names = ['red','green','blue']
bands = []
# Construct xarray for scene
for band_name in band_names:
# Specify chunk size (x,y), Landsat COG is natively in 512 chunks so is best to use this or a multiple
band = sceneid[band_name](chunks=dict(band=1, x=2048, y=2048),urlpath=sceneid[band_name].metadata['alternate']['s3']['href']).to_dask()
band['band'] = [band_name]
bands.append(band)
scene = xr.concat(bands, dim='band')
scene
LC08_L1TP_008012_20190507_20200829_02_T1
<xarray.DataArray (band: 3, y: 8491, x: 8431)>
dask.array<concatenate, shape=(3, 8491, 8431), dtype=uint16, chunksize=(1, 2048, 2048), chunktype=numpy.ndarray>
Coordinates:
* band (band) <U5 'red' 'green' 'blue'
* y (y) float64 7.702e+06 7.702e+06 7.702e+06 ... 7.447e+06 7.447e+06
* x (x) float64 4.371e+05 4.371e+05 4.372e+05 ... 6.9e+05 6.9e+05
Attributes:
transform: (30.0, 0.0, 437085.0, 0.0, -30.0, 7701615.0)
crs: +init=epsg:32622
res: (30.0, 30.0)
is_tiled: 1
nodatavals: (0.0,)
scales: (1.0,)
offsets: (0.0,)
AREA_OR_POINT: PointTypically, it’s best to align dask chunks with the way image chunks (typically called “tiles”) are stored on disk or cloud storage buckets. The landsat data is stored on AWS S3 in a tiled Geotiff format where tiles are 512x512, so we should pick some multiple of that, and typically aim for chunk sizes of ~100Mb (although this is subjective). You can read more about dask chunks here: https://docs.dask.org/en/latest/array-best-practices.html.
Similarly as with pandas, we can explore variables easily in xarray. This time we can work with coordinates (equivalent to indices in pandas). Here x might often be the longitude (it can be renamed to this actually):
scene.x
<xarray.DataArray 'x' (x: 8431)> array([437100., 437130., 437160., ..., 689940., 689970., 690000.]) Coordinates: * x (x) float64 4.371e+05 4.371e+05 4.372e+05 ... 6.9e+05 6.9e+05
We can also keep track of arbitrary metadata (called attributes) in the form of a Python dictionary:
scene.attrs
{'transform': (30.0, 0.0, 437085.0, 0.0, -30.0, 7701615.0),
'crs': '+init=epsg:32622',
'res': (30.0, 30.0),
'is_tiled': 1,
'nodatavals': (0.0,),
'scales': (1.0,),
'offsets': (0.0,),
'AREA_OR_POINT': 'Point'}
scene.crs
'+init=epsg:32622'
We can apply operations over dimensions by name. Here, if we want to slice the data to only have the blue band:
scene.sel(band='blue')
<xarray.DataArray (y: 8491, x: 8431)>
dask.array<getitem, shape=(8491, 8431), dtype=uint16, chunksize=(2048, 2048), chunktype=numpy.ndarray>
Coordinates:
band <U5 'blue'
* y (y) float64 7.702e+06 7.702e+06 7.702e+06 ... 7.447e+06 7.447e+06
* x (x) float64 4.371e+05 4.371e+05 4.372e+05 ... 6.9e+05 6.9e+05
Attributes:
transform: (30.0, 0.0, 437085.0, 0.0, -30.0, 7701615.0)
crs: +init=epsg:32622
res: (30.0, 30.0)
is_tiled: 1
nodatavals: (0.0,)
scales: (1.0,)
offsets: (0.0,)
AREA_OR_POINT: PointNotice that instead of loc (from pandas) we are using sel, but they function synonymously.
Mathematical operations (e.g., x - y) vectorize across multiple dimensions (array broadcasting) based on dimension names. Let’s determine the mean reflectance for the blue band:
scene.sel(band='blue').mean()#.values
<xarray.DataArray ()>
dask.array<mean_agg-aggregate, shape=(), dtype=float64, chunksize=(), chunktype=numpy.ndarray>
Coordinates:
band <U5 'blue'And you can easily use the split-apply-combine paradigm with groupby, which we won’t show here.
Advanced multi-dimensional read-ins, manipulation and visualization
Now let’s open all the bands and multiple days together into an xarray. This will be a more complex xarray with an extra 'time' dimension. Since the catalog we have has a combination of Level 1 and 2 data, let’s keep only the scene IDs for Level 1 data.
sceneids = list(catalog)
sceneids = [sceneid for sceneid in sceneids if sceneid.endswith('_T1')]
sceneids
['LC08_L1TP_008012_20190507_20200829_02_T1',
'LC08_L1TP_008011_20190507_20200828_02_T1']
Let’s create the time variable first for the xarray time dimension. This finds the desired scene IDs in the geopandas dataframe we have above and extracts their ‘datetime’ information. These datetimes get recorded into an xarray variable object for ‘time’.
# Create time variable for time dim
time_var = xr.Variable('time',gf.loc[gf.id.isin(sceneids)]['datetime'])
time_var
<xarray.Variable (time: 2)>
array(['2019-05-07T14:54:18.865854+00:00',
'2019-05-07T14:53:54.970581+00:00'], dtype=object)Now we will search and collect band names for grabbing each desired band. We will just grab the bands that have 30 m pixels. This provides and example of how you can search data in the STAC catalog.
band_names = []
# Get band names
sceneid = catalog[sceneids[1]]
for k in sceneid.keys():
M = getattr(sceneid, k).metadata
if 'eo:bands' in M:
resol = M['eo:bands'][0]['gsd']
print(k, resol)
if resol == 30:
band_names.append(k)
# Add qa band
band_names.append('qa_pixel')
coastal 30
blue 30
green 30
red 30
nir08 30
swir16 30
swir22 30
pan 15
cirrus 30
lwir11 100
lwir12 100
And now open all of it…
# Import to xarray
# In xarray dataframe nans are in locations where concat of multiple scenes has expanded the grid (i.e. different path/rows).
scenes = []
for sceneid in sceneids:
sceneid = catalog[sceneid]
print (sceneid.name)
bands = []
# Construct xarray for scene, open each band, append and concatenate together to create a scene,
# then append and concatenate each scene to create the full dataframe
for band_name in band_names:
band = sceneid[band_name](chunks=dict(band=1, x=2048, y=2048),urlpath=sceneid[band_name].metadata['alternate']['s3']['href']).to_dask()
band['band'] = [band_name]
bands.append(band)
scene = xr.concat(bands, dim='band')
scenes.append(scene)
# Concatenate scenes with time variable
ls_scenes = xr.concat(scenes, dim=time_var)
ls_scenes
LC08_L1TP_008012_20190507_20200829_02_T1
LC08_L1TP_008011_20190507_20200828_02_T1
<xarray.DataArray (time: 2, band: 9, y: 13621, x: 14291)>
dask.array<concatenate, shape=(2, 9, 13621, 14291), dtype=float64, chunksize=(1, 1, 2048, 2048), chunktype=numpy.ndarray>
Coordinates:
* y (y) float64 7.447e+06 7.447e+06 7.447e+06 ... 7.855e+06 7.856e+06
* x (x) float64 2.613e+05 2.613e+05 2.614e+05 ... 6.9e+05 6.9e+05
* band (band) <U8 'coastal' 'blue' 'green' ... 'cirrus' 'qa_pixel'
* time (time) object '2019-05-07T14:54:18.865854+00:00' '2019-05-07T14:...
Attributes:
transform: (30.0, 0.0, 437085.0, 0.0, -30.0, 7701615.0)
crs: +init=epsg:32622
res: (30.0, 30.0)
is_tiled: 1
nodatavals: (0.0,)
scales: (1.0,)
offsets: (0.0,)
AREA_OR_POINT: PointWe now have 2 Landsat scenes with all of the bands we are interested in stored in an xarray, but you can imagine that this exact code can scale to years worth of data and bands.
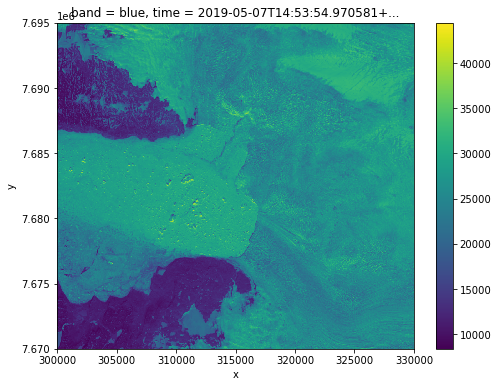
From here, we easily subset one image at a time or the entire xarray:
sbands = ['blue', 'nir08', 'swir16']
# Select the first datetime
t = ls_scenes.time.values[1]
print (t)
# Upper left and lower right coordinates for subsetting to Jakobshavn area
ulx = 300000
uly = 7695000
lrx = 330000
lry = 7670000
image = ls_scenes.sel(time=t,band=sbands,y=slice(lry,uly),x=slice(ulx,lrx))
2019-05-07T14:53:54.970581+00:00
fig, ax = plt.subplots(figsize=(8,6))
image.sel(band='blue').plot()
<matplotlib.collections.QuadMesh at 0x7f11ac2ea5b0>
Since this data is in UTM 22N, we can reproject to the standard lat/lon coordinate system (WGS-84) and map with the ICESat-2 and ATM lines.
image = image.rio.reproject(4326)
ISlats = [is2_gt2r['lat'].min(), is2_gt2r['lat'].max()]
# ISlons = (is2_gt2r['lon'].max(), is2_gt2r['lon'].min())
ISlons = [-55.624,-55.646]
ATMlats = [atm_l2['Latitude(deg)'].min(), atm_l2['Latitude(deg)'].max()]
# ATMlons = [atm_l2['Longitude(deg)'].max(), atm_l2['Longitude(deg)'].min()]
ATMlons = [-55.624,-55.646]
fig, ax = plt.subplots(figsize=(8,6))
image.sel(band='blue').plot()
plt.plot(ISlons,ISlats,color = 'green')
plt.plot(ATMlons,ATMlats,color = 'orange')
Warning 1: +init=epsg:XXXX syntax is deprecated. It might return a CRS with a non-EPSG compliant axis order.
[<matplotlib.lines.Line2D at 0x7f119d509a60>]
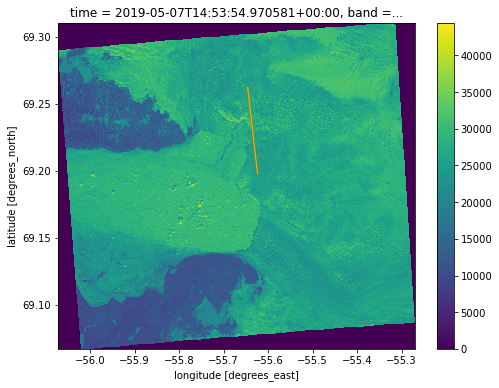
The reprojection to WGS-84 calculated the longitudes to be 6 degrees off, so we shifted the IS2 and ATM data for ease of visualization. This issue only seems to arise with reprojections from some UTM projections and should not be an issue with most data.
4. Summary
Congratulations! You’ve completed the tutorial. In this tutorial you have gained the skills to:
Search for non-ICESat-2 datasets
Open data into
pandasandxarraydataframes/arrays, andManipulate, visualize, and explore the data
We have concluded by mapping the three data sets together. We will revisit the ICESat-2 and ATM data at Jakobshavn and integrate it with processed velocity data in Part II of this tutorial tomorrow!